Global Warming Thread VIII
Moderator: Jon Estes
113 posts
• Page 2 of 5 • 1, 2, 3, 4, 5

Re: Global Warming Thread VIII
![]() by KeithE » Thu Apr 01, 2010 7:03 am
by KeithE » Thu Apr 01, 2010 7:03 am
Give youself a golden spur.
Informed by Data.
Driven by the SPIRIT and JESUS’s Example.
Promoting the Kingdom of GOD on Earth.
Driven by the SPIRIT and JESUS’s Example.
Promoting the Kingdom of GOD on Earth.
-

KeithE - Site Admin
- Posts: 9362
- Joined: Thu Aug 12, 2004 8:02 pm
- Location: Huntsville, AL
Re: Global Warming Thread VIII
![]() by KeithE » Sat Apr 10, 2010 9:04 am
by KeithE » Sat Apr 10, 2010 9:04 am
Informed by Data.
Driven by the SPIRIT and JESUS’s Example.
Promoting the Kingdom of GOD on Earth.
Driven by the SPIRIT and JESUS’s Example.
Promoting the Kingdom of GOD on Earth.
-
KeithE - Site Admin
- Posts: 9362
- Joined: Thu Aug 12, 2004 8:02 pm
- Location: Huntsville, AL
Re: Global Warming Thread VIII
![]() by KeithE » Tue Apr 13, 2010 10:21 pm
by KeithE » Tue Apr 13, 2010 10:21 pm
#1 You would see from Roy Spencer's data plotting package of the AMSU data, that the GLOBALLY averaged temp anomalies as measured by his AMSU sensor has been higher that any other year for all the data he makes available since about July of last year (with some exceptions, actually no exceptions since Jan 11, 2010). Have you or have you not availed yourself of this data at ? Follow the instructions. And I'm sorry I have not figured out how to enlarge the plots myself to paste them into posts.
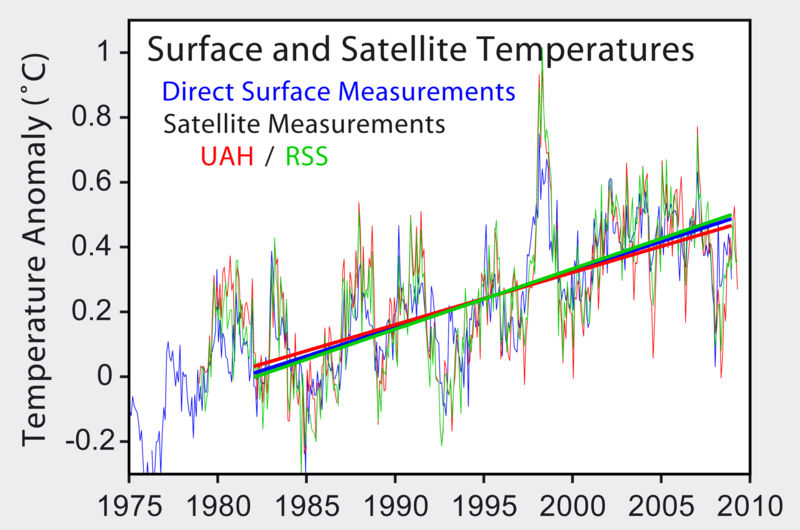
Overall for the period July 2009 until 10 April 2010 the temp anomaly is about 0.3 C higher than 1998. What this means is that the temp anomaly (for at least the UAH data in red) will be ~0.3C higher than 1998 and this off the chart of the graph I often give, repeated below.
That my friend is extraordinarily! All other years are clumped together (if you check all the year boxes for any AMSU data plot). 2010 thus far annd late 2009 stick out like a sore thumb. The rapid rise throughout the 1900's is also faster than at any other previous time even the ice age to non-ice age rapid change every 135,000 years or so (as shown by the Volstok ice coe data does not rise that fast (when you bother to check the x-axis scale)). And this rapid rise has overcome a negative trend that the Miklanovitch cycles would demand (i.e. it overcame the little ice age trend).
The days of temp leveling off since 1998 are over due to the return of the El Nino as was also present in 1998. As stated numerous times the ocean heat content has continued to increase in the 2000's and the sea level has continue to increase in the 2000's as well (the absorbed re-radiated earthshine has to go somewhere. It has gone into the oceans since 2000 [not the air temp] as it did in the period 194-1970, while CO2 was rising [and therefore absorbed earthshine increased] as it continues to do today).
#2 "this chart" refers to the AMSU data (first smaller plot inmy post above being one such example), not the big plot repeated above in this post.
#3 OK I'll read #4
#4 I have refuted D'Aleo's charts as being limited to small areas of the earth (2% and 10%) respevctively. One can hardly claim GLOBALNESS with such small areas. Read the AMSU data for GLOBAL data. As for D'Aleo's article it quotes delta temps from 1 Dec 09 to 15 Feb 2010 a cherry picked time frame for which in the northern hemisphere (which he also chooses to isolate on) the temps usually go down during that period. Also read what I said in red above.
---------------------
I have better things to do with my time than argue with a data analysis challenged person who is constantly duped by propaganda. Phil Jones has been cleared of all but being harsh on opponents in what he thought was private email (and his harshness deosn't hold a candle to the sarcasm of the denialists - I can hardly imagne what their emial says!).
I'm awaiting any readjustment of the temp station records to see if lo and behold the very rapid temp rise we have seen in the 1900's is at all refuted after any corrections. They would have to contradict both the satellite data bases (UAH MSU and the RSS sensor) given in the plot above (this post) if it changed materially.
Some corrections were made for Y2K at the demand of denialists and you can hardly tell the difference.

The Hockey stick was corrected but Mann's main conclusion that the rate of temp increase in the 1900's is larger than anytime in the last 1000 years. The MWP was a slow rolling increass of about 0.15C (and that is debatable based on noise-level involved and the isolated nature of the data) while the 1900's has seen a rapid rise of 0.8C (when the best corrected data is used).

Minor corrections may be warranted but those done to date at the behests of denialists have meant next to nothing. The station data is again being looked at by the NAS and I doubt that any substantial dent in responsible GW conclusions will result. Plus we are experiencing a jump akin to the jump in 1998 this year (since June/July last year actually). The yearly result will be off the chart (over 1.0C temp anomaly) unless some volcanoe cools things off this year. But the sea level continues to rise regardless and that is the final integrator (sea, air, land).
David, I'm tired of saying the same things over and over again to you and you are too stubborn/duped/dense to understand. I have noticed the decreasing amount of viewership we have had since moving to this forum. I do not write to try to convince you, David, but to correct your misunderstandings from being promulgated. My replies are going to be fewer and fewer unless you come up with some real and new challenges.
Overall for the period July 2009 until 10 April 2010 the temp anomaly is about 0.3 C higher than 1998. What this means is that the temp anomaly (for at least the UAH data in red) will be ~0.3C higher than 1998 and this off the chart of the graph I often give, repeated below.
That my friend is extraordinarily! All other years are clumped together (if you check all the year boxes for any AMSU data plot). 2010 thus far annd late 2009 stick out like a sore thumb. The rapid rise throughout the 1900's is also faster than at any other previous time even the ice age to non-ice age rapid change every 135,000 years or so (as shown by the Volstok ice coe data does not rise that fast (when you bother to check the x-axis scale)). And this rapid rise has overcome a negative trend that the Miklanovitch cycles would demand (i.e. it overcame the little ice age trend).
The days of temp leveling off since 1998 are over due to the return of the El Nino as was also present in 1998. As stated numerous times the ocean heat content has continued to increase in the 2000's and the sea level has continue to increase in the 2000's as well (the absorbed re-radiated earthshine has to go somewhere. It has gone into the oceans since 2000 [not the air temp] as it did in the period 194-1970, while CO2 was rising [and therefore absorbed earthshine increased] as it continues to do today).
#2 "this chart" refers to the AMSU data (first smaller plot inmy post above being one such example), not the big plot repeated above in this post.
#3 OK I'll read #4
#4 I have refuted D'Aleo's charts as being limited to small areas of the earth (2% and 10%) respevctively. One can hardly claim GLOBALNESS with such small areas. Read the AMSU data for GLOBAL data. As for D'Aleo's article it quotes delta temps from 1 Dec 09 to 15 Feb 2010 a cherry picked time frame for which in the northern hemisphere (which he also chooses to isolate on) the temps usually go down during that period. Also read what I said in red above.
---------------------
I have better things to do with my time than argue with a data analysis challenged person who is constantly duped by propaganda. Phil Jones has been cleared of all but being harsh on opponents in what he thought was private email (and his harshness deosn't hold a candle to the sarcasm of the denialists - I can hardly imagne what their emial says!).
I'm awaiting any readjustment of the temp station records to see if lo and behold the very rapid temp rise we have seen in the 1900's is at all refuted after any corrections. They would have to contradict both the satellite data bases (UAH MSU and the RSS sensor) given in the plot above (this post) if it changed materially.
Some corrections were made for Y2K at the demand of denialists and you can hardly tell the difference.
The Hockey stick was corrected but Mann's main conclusion that the rate of temp increase in the 1900's is larger than anytime in the last 1000 years. The MWP was a slow rolling increass of about 0.15C (and that is debatable based on noise-level involved and the isolated nature of the data) while the 1900's has seen a rapid rise of 0.8C (when the best corrected data is used).
Minor corrections may be warranted but those done to date at the behests of denialists have meant next to nothing. The station data is again being looked at by the NAS and I doubt that any substantial dent in responsible GW conclusions will result. Plus we are experiencing a jump akin to the jump in 1998 this year (since June/July last year actually). The yearly result will be off the chart (over 1.0C temp anomaly) unless some volcanoe cools things off this year. But the sea level continues to rise regardless and that is the final integrator (sea, air, land).
David, I'm tired of saying the same things over and over again to you and you are too stubborn/duped/dense to understand. I have noticed the decreasing amount of viewership we have had since moving to this forum. I do not write to try to convince you, David, but to correct your misunderstandings from being promulgated. My replies are going to be fewer and fewer unless you come up with some real and new challenges.
Informed by Data.
Driven by the SPIRIT and JESUS’s Example.
Promoting the Kingdom of GOD on Earth.
Driven by the SPIRIT and JESUS’s Example.
Promoting the Kingdom of GOD on Earth.
-
KeithE - Site Admin
- Posts: 9362
- Joined: Thu Aug 12, 2004 8:02 pm
- Location: Huntsville, AL
Re: Global Warming Thread VIII
![]() by KeithE » Sat Apr 17, 2010 4:21 pm
by KeithE » Sat Apr 17, 2010 4:21 pm
Informed by Data.
Driven by the SPIRIT and JESUS’s Example.
Promoting the Kingdom of GOD on Earth.
Driven by the SPIRIT and JESUS’s Example.
Promoting the Kingdom of GOD on Earth.
-
KeithE - Site Admin
- Posts: 9362
- Joined: Thu Aug 12, 2004 8:02 pm
- Location: Huntsville, AL
Re: Global Warming Thread VIII
![]() by KeithE » Sun Apr 18, 2010 8:44 am
by KeithE » Sun Apr 18, 2010 8:44 am
Like I've been saying many/most of the true scientific community say the IPCC is not "alarming" enough - too compromised with politics.

Informed by Data.
Driven by the SPIRIT and JESUS’s Example.
Promoting the Kingdom of GOD on Earth.
Driven by the SPIRIT and JESUS’s Example.
Promoting the Kingdom of GOD on Earth.
-
KeithE - Site Admin
- Posts: 9362
- Joined: Thu Aug 12, 2004 8:02 pm
- Location: Huntsville, AL
Re: Global Warming Thread VIII
![]() by KeithE » Mon Apr 26, 2010 7:17 am
by KeithE » Mon Apr 26, 2010 7:17 am
Arctic Temps: Here's the long term trend (folllows the global temp trend with dip in 1940-1970)
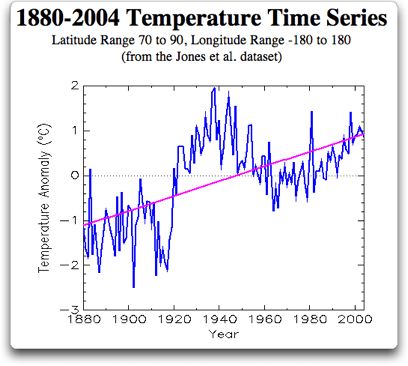
It is true that the 1940"s were warmer in the Arctic than today.
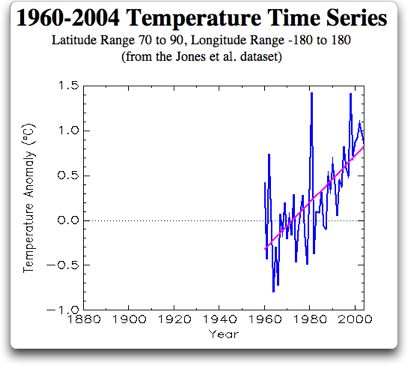
But the rate of growth since 1960 is about .25C/decade (~twice the rate of the rest of the world)
You can peruse Arctic station temp data at
Russian guy cited no DATA and when I look, I find no basis for what he is saying.
Arctic Sea Ice: The March sea ice extent may have creeped a little higher since a low of 2007 and may even be the highest in 8 years according to one source JAXA as denialist Anthony Watts has found (carefully not plotting data proir to 2002). (I say may because I could not link to the data site this morning and I never trust a denialist)

But the trend since 1950 has been negative

But the far more telling trend is the sea ice volume which continues to decline quite markedly.

And btw, David, have you yet looked at Spencer's AMSU data? It shows a annual plot much like Watts's plot (up 3 plots in this post) but it is like the red line in the plot above (current year) is always above all other years since and including 1998 (not just breaking over the rest of the years like Anthony Watts was so eager to point). That shows his strong cherry picking in what is reports.
It is true that the 1940"s were warmer in the Arctic than today.
But the rate of growth since 1960 is about .25C/decade (~twice the rate of the rest of the world)
You can peruse Arctic station temp data at
Russian guy cited no DATA and when I look, I find no basis for what he is saying.
Arctic Sea Ice: The March sea ice extent may have creeped a little higher since a low of 2007 and may even be the highest in 8 years according to one source JAXA as denialist Anthony Watts has found (carefully not plotting data proir to 2002). (I say may because I could not link to the data site this morning and I never trust a denialist)
But the trend since 1950 has been negative
But the far more telling trend is the sea ice volume which continues to decline quite markedly.
And btw, David, have you yet looked at Spencer's AMSU data? It shows a annual plot much like Watts's plot (up 3 plots in this post) but it is like the red line in the plot above (current year) is always above all other years since and including 1998 (not just breaking over the rest of the years like Anthony Watts was so eager to point). That shows his strong cherry picking in what is reports.
Informed by Data.
Driven by the SPIRIT and JESUS’s Example.
Promoting the Kingdom of GOD on Earth.
Driven by the SPIRIT and JESUS’s Example.
Promoting the Kingdom of GOD on Earth.
-
KeithE - Site Admin
- Posts: 9362
- Joined: Thu Aug 12, 2004 8:02 pm
- Location: Huntsville, AL
Re: Global Warming Thread VIII
![]() by KeithE » Wed Apr 28, 2010 9:20 pm
by KeithE » Wed Apr 28, 2010 9:20 pm
It's Morner vs real sea level researchers, real DATA (tidal guages, altimeters). We hashed that around several times and I notice very few other people are reading our posts lately.
I quit but not because you are right.
I quit but not because you are right.
Last edited by KeithE on Thu Apr 29, 2010 6:30 am, edited 1 time in total.
Informed by Data.
Driven by the SPIRIT and JESUS’s Example.
Promoting the Kingdom of GOD on Earth.
Driven by the SPIRIT and JESUS’s Example.
Promoting the Kingdom of GOD on Earth.
-
KeithE - Site Admin
- Posts: 9362
- Joined: Thu Aug 12, 2004 8:02 pm
- Location: Huntsville, AL
Re: Global Warming Thread VIII
![]() by Ed Edwards » Wed Apr 28, 2010 10:30 pm
by Ed Edwards » Wed Apr 28, 2010 10:30 pm
Alas, Brother KeithE -- no amount of Logic can quench the fires of illogic.
Ed Edwards -- another Baptist for preservation of the earth
Ed Edwards -- another Baptist for preservation of the earth

( for the physical Millennial Messianic Reign of Jesus )

-- Ed Edwards, AGW Dude
(AGW = Anthropogenic Global Warming)
- Ed Edwards
- Posts: 615
- Joined: Mon Jun 20, 2005 10:21 pm
- Location: Exciting Central Oklahoma
Re: Global Warming Thread VIII
![]() by KeithE » Mon May 03, 2010 7:51 am
by KeithE » Mon May 03, 2010 7:51 am
Informed by Data.
Driven by the SPIRIT and JESUS’s Example.
Promoting the Kingdom of GOD on Earth.
Driven by the SPIRIT and JESUS’s Example.
Promoting the Kingdom of GOD on Earth.
-
KeithE - Site Admin
- Posts: 9362
- Joined: Thu Aug 12, 2004 8:02 pm
- Location: Huntsville, AL
Re: Global Warming Thread VIII
![]() by KeithE » Mon May 03, 2010 10:58 pm
by KeithE » Mon May 03, 2010 10:58 pm
Informed by Data.
Driven by the SPIRIT and JESUS’s Example.
Promoting the Kingdom of GOD on Earth.
Driven by the SPIRIT and JESUS’s Example.
Promoting the Kingdom of GOD on Earth.
-
KeithE - Site Admin
- Posts: 9362
- Joined: Thu Aug 12, 2004 8:02 pm
- Location: Huntsville, AL
Re: Global Warming Thread VIII
![]() by Ed Edwards » Thu May 06, 2010 3:13 pm
by Ed Edwards » Thu May 06, 2010 3:13 pm
// Global Warming Alarm Based on Faulty Forecasting Procedures: ... //
Does anybody here know that such statements are true
IF or NOT IF // Global WARMING alarms are based on Faulty Forcasting procedures. //
Consider to be true:
// Global WARMING alarms are based on Faulty Forcasting procedures //
IF this is true, then the alarm has been sounded and Global Warming will appear be abated and/or made less.
Consider to be false (That is, the forcasting procedures for Global Warming are accurate):
// Global WARMING alarms are based on Faulty Forcasting procedures //
Then people will heed the alarm and Global Warming will be abated and/or made less.
So, the statement quoted from the last post is MEANINGLESS, and proves nothing.
( for the physical Millennial Messianic Reign of Jesus )
-- Ed Edwards, AGW Dude
(AGW = Anthropogenic Global Warming)
- Ed Edwards
- Posts: 615
- Joined: Mon Jun 20, 2005 10:21 pm
- Location: Exciting Central Oklahoma
113 posts
• Page 2 of 5 • 1, 2, 3, 4, 5
Return to Politics and Public Policy Issues
Who is online
Users browsing this forum: No registered users and 13 guests